

Key Takeaways
- Expense ratios are annual fees charged as a percentage of your investment balance, deducted automatically.
- Even a 1% difference in fees can reduce your ending balance by tens of thousands of dollars over decades.
- Passively managed index funds generally carry much lower expense ratios than actively managed funds.
- Fees compound against you the same way returns compound for you - time amplifies the effect.
- Always check the expense ratio before investing in any fund; it is one of the few costs you can control.
Expense Ratio
An expense ratio is the annual fee a mutual fund or ETF charges investors to cover its operating costs. It is expressed as a percentage of your invested balance and deducted automatically - you never write a check. For example, a 1% expense ratio on a $10,000 investment means $100 is taken out each year to cover fund management and administrative costs.
The expense ratio is calculated by dividing the fund's total annual operating expenses by its average net assets. It is disclosed in the fund's prospectus and must be reported to the SEC annually.
Why a Small Percentage Is Not a Small Thing
When you invest in a mutual fund or exchange-traded fund (ETF), you are effectively pooling money with other investors to buy a collection of assets. Managing that pool costs money - for research, administration, and legal compliance - and those costs are passed to investors through the expense ratio.
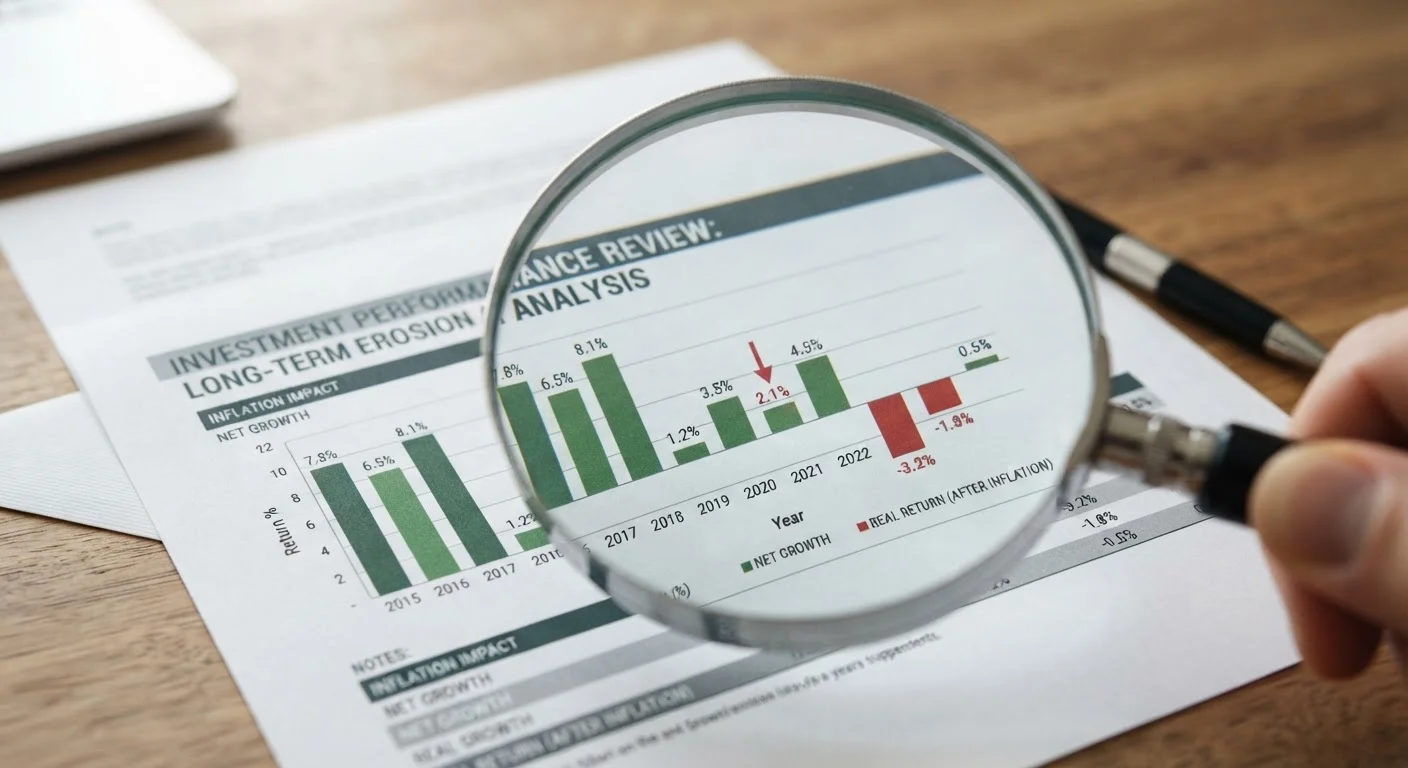
The percentage looks harmless: 0.05%, 0.75%, 1.20%. But because the fee is charged on your entire balance each year, and because investing is a long-term activity, even small differences compound dramatically. Consider two investors who each start with $20,000 and earn an identical 7% gross annual return over 30 years. One holds a fund with a 0.10% expense ratio; the other holds a fund charging 1.00%. The lower-fee investor ends with roughly $140,000 more - not because of better market performance, but simply because less was taken out along the way.
~$100K+
Potential fee drag on a 30-year retirement portfolio
Illustrative projections show that a 1% annual fee difference on a $20,000 starting balance growing at 7% per year can reduce the ending balance by more than $100,000 over 30 years.
< 0.10%
Typical expense ratio for broad-market index funds
Many passively managed index ETFs and mutual funds now carry expense ratios well below 0.10%, compared to 0.50%-1.50%+ for actively managed counterparts.
0.44%
Average expense ratio across all U.S. mutual funds and ETFs
According to Morningstar's annual fee study, the asset-weighted average expense ratio for U.S. funds has declined steadily over the past two decades as low-cost index investing has grown.
This is the core problem: fees reduce the portion of your return that stays invested, and that reduction compounds year after year. As the foundational investing concepts guide explains, compounding works powerfully in your favor - but the same mechanism means fees work powerfully against you.
The Main Types of Investment Fees
Expense ratios are the most common fee, but they are not the only one. Understanding the full landscape helps you evaluate the true cost of any investment.
- Expense ratio: The annual operating cost of the fund, expressed as a percentage of assets. Charged continuously and automatically.
- Sales loads: Commissions paid when you buy (front-end load) or sell (back-end load) a fund. Not all funds charge these; many are described as "no-load."
- 12b-1 fees: A subset of the expense ratio used to cover marketing and distribution costs. Funds are required to disclose this separately.
- Account or platform fees: Some brokerages charge annual or monthly account maintenance fees, particularly on smaller balances.
- Trading commissions: Fees charged per trade, though many platforms now offer commission-free ETF and stock trades.
New investors sometimes focus only on a fund's headline return and overlook this fee stack entirely - a pattern discussed in more depth in the article on common traps new investors fall into.
Always Read the Summary Prospectus
Before investing in any fund, download or review its summary prospectus - a standardized disclosure document required by the SEC. It clearly lists the expense ratio, any sales loads, and other fees in a standardized format, making it easy to compare funds side by side. Most fund companies and brokerage platforms make this document available in one click.
Passive vs. Active: Where Fee Differences Come From
Actively managed funds employ portfolio managers who research and select individual investments, aiming to outperform a market benchmark. That labor is expensive and is reflected in the expense ratio - often 0.50% to 1.50% or more annually.
Passively managed index funds simply track a market index, like the S&P 500, with minimal trading and no research team needed. Their expense ratios often fall below 0.10%. The gap in fees is structural, not incidental.
“In investing, you get what you don't pay for. Costs matter enormously in this business, and over time, the cumulative effect of fees is one of the most powerful determinants of net investor returns.”
— John C. Bogle, Founder of Vanguard and pioneer of index fund investing
The practical implication: before choosing between a passive and active approach, a clear-eyed look at fees is essential. If an actively managed fund charges 1.00% more per year than an index alternative, it needs to outperform that alternative by at least 1.00% annually just to break even on a net-return basis - a difficult bar to clear consistently over long periods. This matters even more for those investing with limited funds, where every dollar retained has proportionally greater impact.
How to Evaluate Fees Before You Invest
You cannot control what markets do, but fees are one of the few investing variables within your reach. Here is a practical framework for reviewing them.
- Locate the expense ratio. It appears in the fund's summary prospectus and on most financial data platforms. Look for "net expense ratio" - some funds temporarily waive a portion of fees, and the net figure reflects what you actually pay now.
- Compare within the same category. A 0.70% expense ratio for an international small-cap fund may be reasonable; the same ratio for a domestic large-cap index fund is high. Benchmark against similar funds.
- Check for sales loads. A no-load fund passes no sales commission costs to you. Funds with front-end loads subtract a percentage from your initial investment before it even begins working for you.
- Account for platform costs. The total cost of investing includes any account fees from your brokerage, not just the fund expense ratio.
Thinking about fees as a percentage also connects to broader budgeting literacy. The percentage-based budgeting approach trains the same instinct: percentages, not raw dollar amounts, reveal the true proportional impact of financial decisions.
Fee Waivers Are Temporary
Some funds temporarily waive part of their expense ratio to make themselves more competitive, particularly newer funds building a track record. The 'gross expense ratio' reflects the full cost without waivers; the 'net expense ratio' reflects what you pay today. If waivers expire, your costs could rise. Always check both figures in the prospectus and note the waiver expiration date if one applies.
This article is for general informational and educational purposes only. It does not constitute personalized financial or investment advice. Please consult a qualified financial professional before making investment decisions based on your individual circumstances.