

Key Takeaways
- Price history tools show past pricing trends but cannot predict future discounts.
- Retailers sometimes inflate prices before sales events, which charts can help reveal.
- Coverage gaps mean some sellers and product variants may not appear in the data.
- Dynamic pricing means a product's cost can change multiple times in a single day.
- These tools work best as one input among several, not as a definitive buying signal.
Exposes artificially inflated pre-sale prices
Charts frequently reveal that a retailer raised a price shortly before a promotional event, making the subsequent 'discount' look larger than it actually is. This is one of the most concrete ways the tools protect shoppers.
Shows typical price range at a glance
Rather than guessing whether a price is reasonable, you can see the historical floor and ceiling for a product, giving you a realistic benchmark without extensive manual research.
Tracks multiple retailers simultaneously
Several tools aggregate data across multiple platforms, letting you compare how a product is priced at different sellers over the same period rather than checking each site individually.
Supports price-drop alerts
Many tools allow you to set a target price and receive a notification when a product hits that threshold, removing the need to monitor listings manually over time.
Cannot capture real-time dynamic price changes
Prices on major retail platforms can shift dozens of times per day. History charts are updated periodically, not continuously, so a chart showing yesterday's price may not reflect what you'll actually pay at checkout.
Coverage is uneven across retailers and listings
Most tools track a limited set of major platforms well and cover smaller or regional sellers poorly. Prices from third-party marketplace sellers within larger platforms are often missing entirely.
Product variant mismatches can mislead
A chart may reflect a different color, storage tier, or bundle configuration than the one you're viewing. Without confirming the data matches your exact item, conclusions drawn from the chart may be inaccurate.
Historical lows don't predict future prices
A product at its tracked low point may still drop further, or the low may be an anomaly that won't recur. Charts describe the past and carry no predictive guarantee about what pricing will do next.
Tools collect user browsing data in return
Most free price history extensions operate on a data-for-service model, collecting information about the pages you visit and items you view. Users should review privacy policies before installing any extension.
Our Verdict
Price history tools are genuinely useful for spotting inflated 'sale' prices and understanding whether a current listing reflects a true discount. Their limitations - including incomplete retailer coverage, variant mismatches, and the inability to account for real-time dynamic pricing - mean they should inform decisions rather than dictate them. Used alongside broader research, they add meaningful context.
Shoppers who frequently buy electronics, appliances, or other big-ticket items online and want historical context before committing to a purchase.
What Price History Tools Actually Do
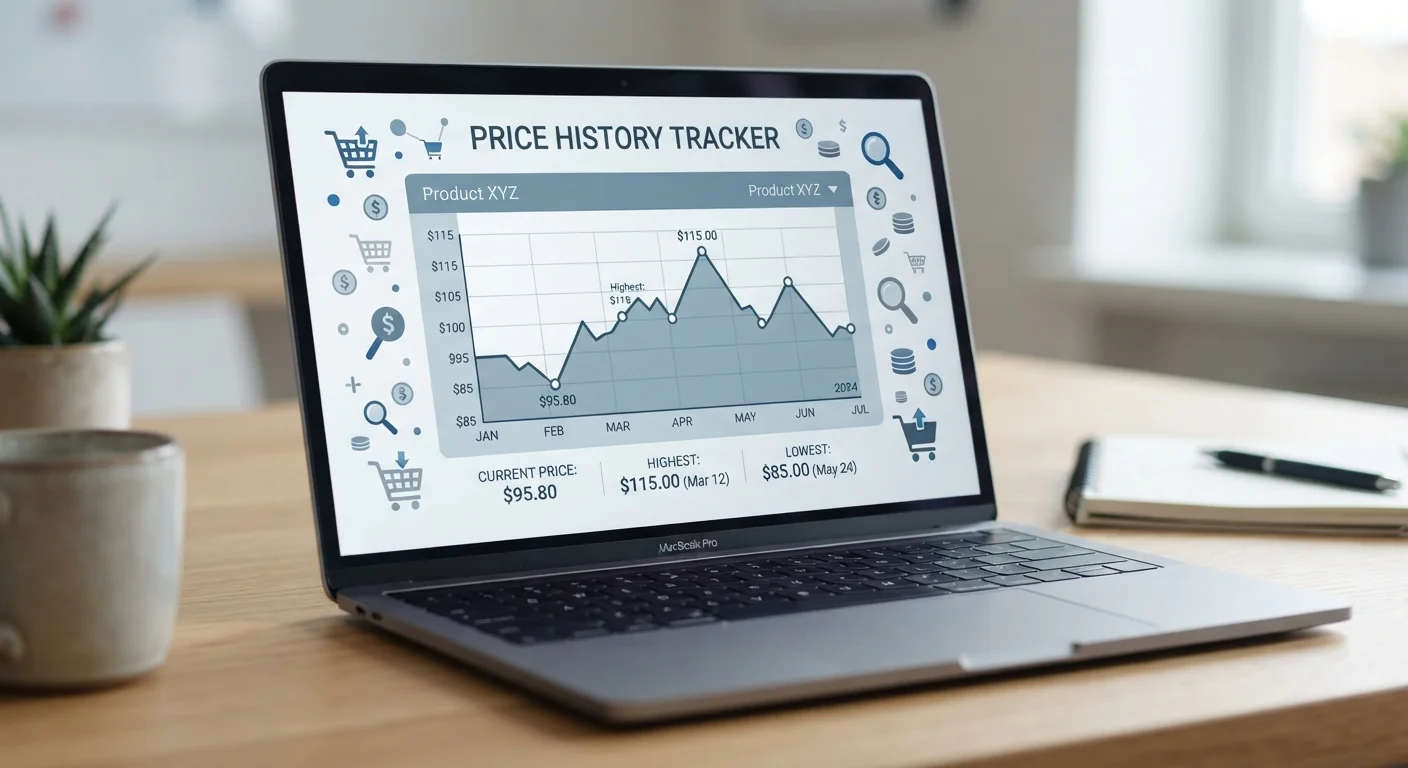
Price history tools - available as browser extensions or standalone tracking websites - record and display the price a specific product has been listed at over time on participating retail platforms. When you visit a product page, these tools overlay a chart showing price fluctuations over weeks or months, giving you a visual sense of whether today's price is high, low, or roughly typical.
The most common use case is verifying sale claims. If a retailer marks an item as "X% off" but the chart shows the price has been at that level for months, the discount framing becomes questionable. This kind of context is exactly what these tools do well. For a broader look at why prices shift so frequently in the first place, see how dynamic pricing works.
Exposes artificially inflated pre-sale prices
Charts frequently reveal that a retailer raised a price shortly before a promotional event, making the subsequent 'discount' look larger than it actually is. This is one of the most concrete ways the tools protect shoppers.
Shows typical price range at a glance
Rather than guessing whether a price is reasonable, you can see the historical floor and ceiling for a product, giving you a realistic benchmark without extensive manual research.
Tracks multiple retailers simultaneously
Several tools aggregate data across multiple platforms, letting you compare how a product is priced at different sellers over the same period rather than checking each site individually.
Supports price-drop alerts
Many tools allow you to set a target price and receive a notification when a product hits that threshold, removing the need to monitor listings manually over time.
Where the Data Falls Short
The charts only reflect data the tool has actually collected - and that collection has real gaps. Many tools focus on a handful of major retailers, meaning prices from smaller marketplaces, regional sellers, or third-party listings on large platforms may be absent or inconsistently tracked.
Product variants are another common blind spot. A tracker may log the price history for a black 64GB model of a device while you're looking at the silver 128GB version - and the two may have very different pricing histories. Relying on a chart without confirming it matches your exact product specification can produce misleading conclusions.
When Charts and Reality Diverge
Price history tools log prices at intervals - often every few hours or once daily - rather than in real time. During high-traffic shopping periods like major sale events, prices can move faster than the tool captures. A chart showing a price from earlier in the day may not match what appears at checkout. Always confirm the current price on the retailer's page before making a decision based on historical data alone.
There's also the question of how retailers respond to being tracked. Price comparison tools have known limitations that experienced shoppers account for - including the fact that some sellers adjust strategies precisely because tracking tools exist.
Cannot capture real-time dynamic price changes
Prices on major retail platforms can shift dozens of times per day. History charts are updated periodically, not continuously, so a chart showing yesterday's price may not reflect what you'll actually pay at checkout.
Coverage is uneven across retailers and listings
Most tools track a limited set of major platforms well and cover smaller or regional sellers poorly. Prices from third-party marketplace sellers within larger platforms are often missing entirely.
Product variant mismatches can mislead
A chart may reflect a different color, storage tier, or bundle configuration than the one you're viewing. Without confirming the data matches your exact item, conclusions drawn from the chart may be inaccurate.
Historical lows don't predict future prices
A product at its tracked low point may still drop further, or the low may be an anomaly that won't recur. Charts describe the past and carry no predictive guarantee about what pricing will do next.
Tools collect user browsing data in return
Most free price history extensions operate on a data-for-service model, collecting information about the pages you visit and items you view. Users should review privacy policies before installing any extension.
Reading the Charts Intelligently
A price history chart shows what was - not what will be. A product sitting at a six-month low today could drop further next week or spike tomorrow based on inventory, demand signals, or a retailer's algorithmic pricing model. Seasonal price cycles can add useful context here: certain product categories tend to dip predictably around specific times of year, and overlaying that knowledge with a chart makes the data more actionable.
When using these tools, also consider what the chart doesn't show: shipping costs, return policy changes, bundled warranty terms, or seller reputation shifts - all of which affect the real value of a purchase. For a rigorous approach, comparing prices meaningfully across sellers requires looking beyond the sticker price alone.
~30%
Products with inflated pre-sale prices
Research by consumer groups in multiple markets has found that a significant share of items marketed as discounted were actually priced higher in the period just before a sale event.
2-3×
Daily price changes on major platforms
Studies of algorithmic pricing behavior have observed that high-demand products on large e-commerce platforms can be repriced multiple times within a single day.
Finally, be aware of the data privacy trade-off. These tools often collect your browsing and shopping behavior. Understanding what shopping extensions track and how is worth your time before installing anything.